data-viz-workshop-2021
Hands-on workshop on effective data visualization - Oct 23, 2021

Scroll to:
Participants
April, Becky Hansis-O’Neill, Benjamin Hamilton, Brett Huffman, Bryan Pierce, Chris Imgarten, Dr. Carletta D. Washington, Faraneh Shamserad, Gabriela Hernandez, Jake Shpringman, Jiajing Chen, Joel Fecke, Karthik Reddy Vanga, Keerthi Vakkalagadda, Lalith reddy, Mannam Jahnavi Deepika, Natalie Piper, Oscar Gordillo, Paola Garcia Egan, Qing Snyder, Santosh Kumar, Sanzida Hoque, Sara Mousavinia, Sean Xu, Shelley Espinoza, Suresh Pokhrel, Tareq Nabhan, Timothy Schultz, and Vijaya Madhuri Puli.
Seventy people had applied, we accepted 50, 35 confirmed to participate, and 29 attended and completed the workshop.
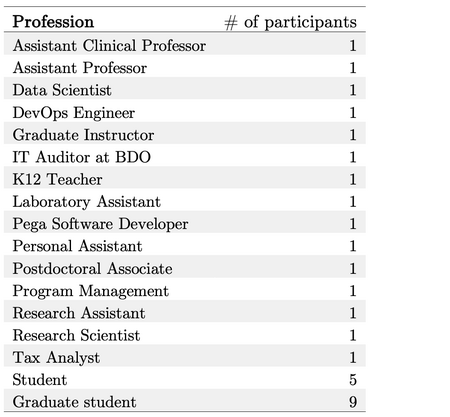
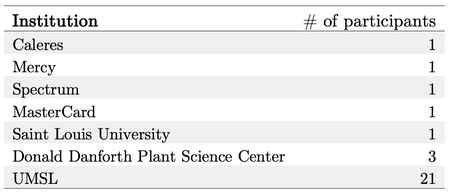
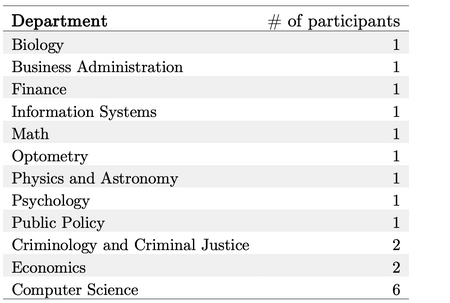
Distributions of participants:
Morning session
Lunch 🥪 Noon to 1 PM
Optional readings during lunch:
Afternoon session
| ⌚ | ⏳ | Topic |
|---|---|---|
| 1:00 PM | 10 min | 📖 Graphical excellence |
| 1:10 PM | 10 min | 📖 Five qualities of good visualizations |
| 1:20 PM | 25 min | 📖 Minard’s & Marey’s / printed charts |
| Discussion | ||
| 1:45 PM | 10 min | 📖 Graphical integrity |
| 1:55 PM | 15 min | 📖 Visualizations should be naked |
| ✏️ Task: Maximize data ink ratio in a box plot / Solution | ||
| 2:10 PM | 15 min | 📖 Chartjunks (The extreme East) |
| 📖 Density | ||
| ✏️ Task: Chartjunks in a bar / Solution | ||
| 2:25 PM | 15 min | 📖 When to dress a plot? |
| 📖 Read any two pages from Storytelling (The extreme West) | ||
| 📖 Words, numbers, and images—together | ||
| 2:40 PM | 10 min | Discussion - “Now that we have shown you the extremes!” |
| 2:50 PM | 10 min | 📖 Color |
| 3:00 PM | 5 min | ✏️ Feedbacks by the participants |
| 3:05 PM | 10 min | 📖 There is no ideal way |
| 3:15 PM | 30 min | ✏️ Concept maps |
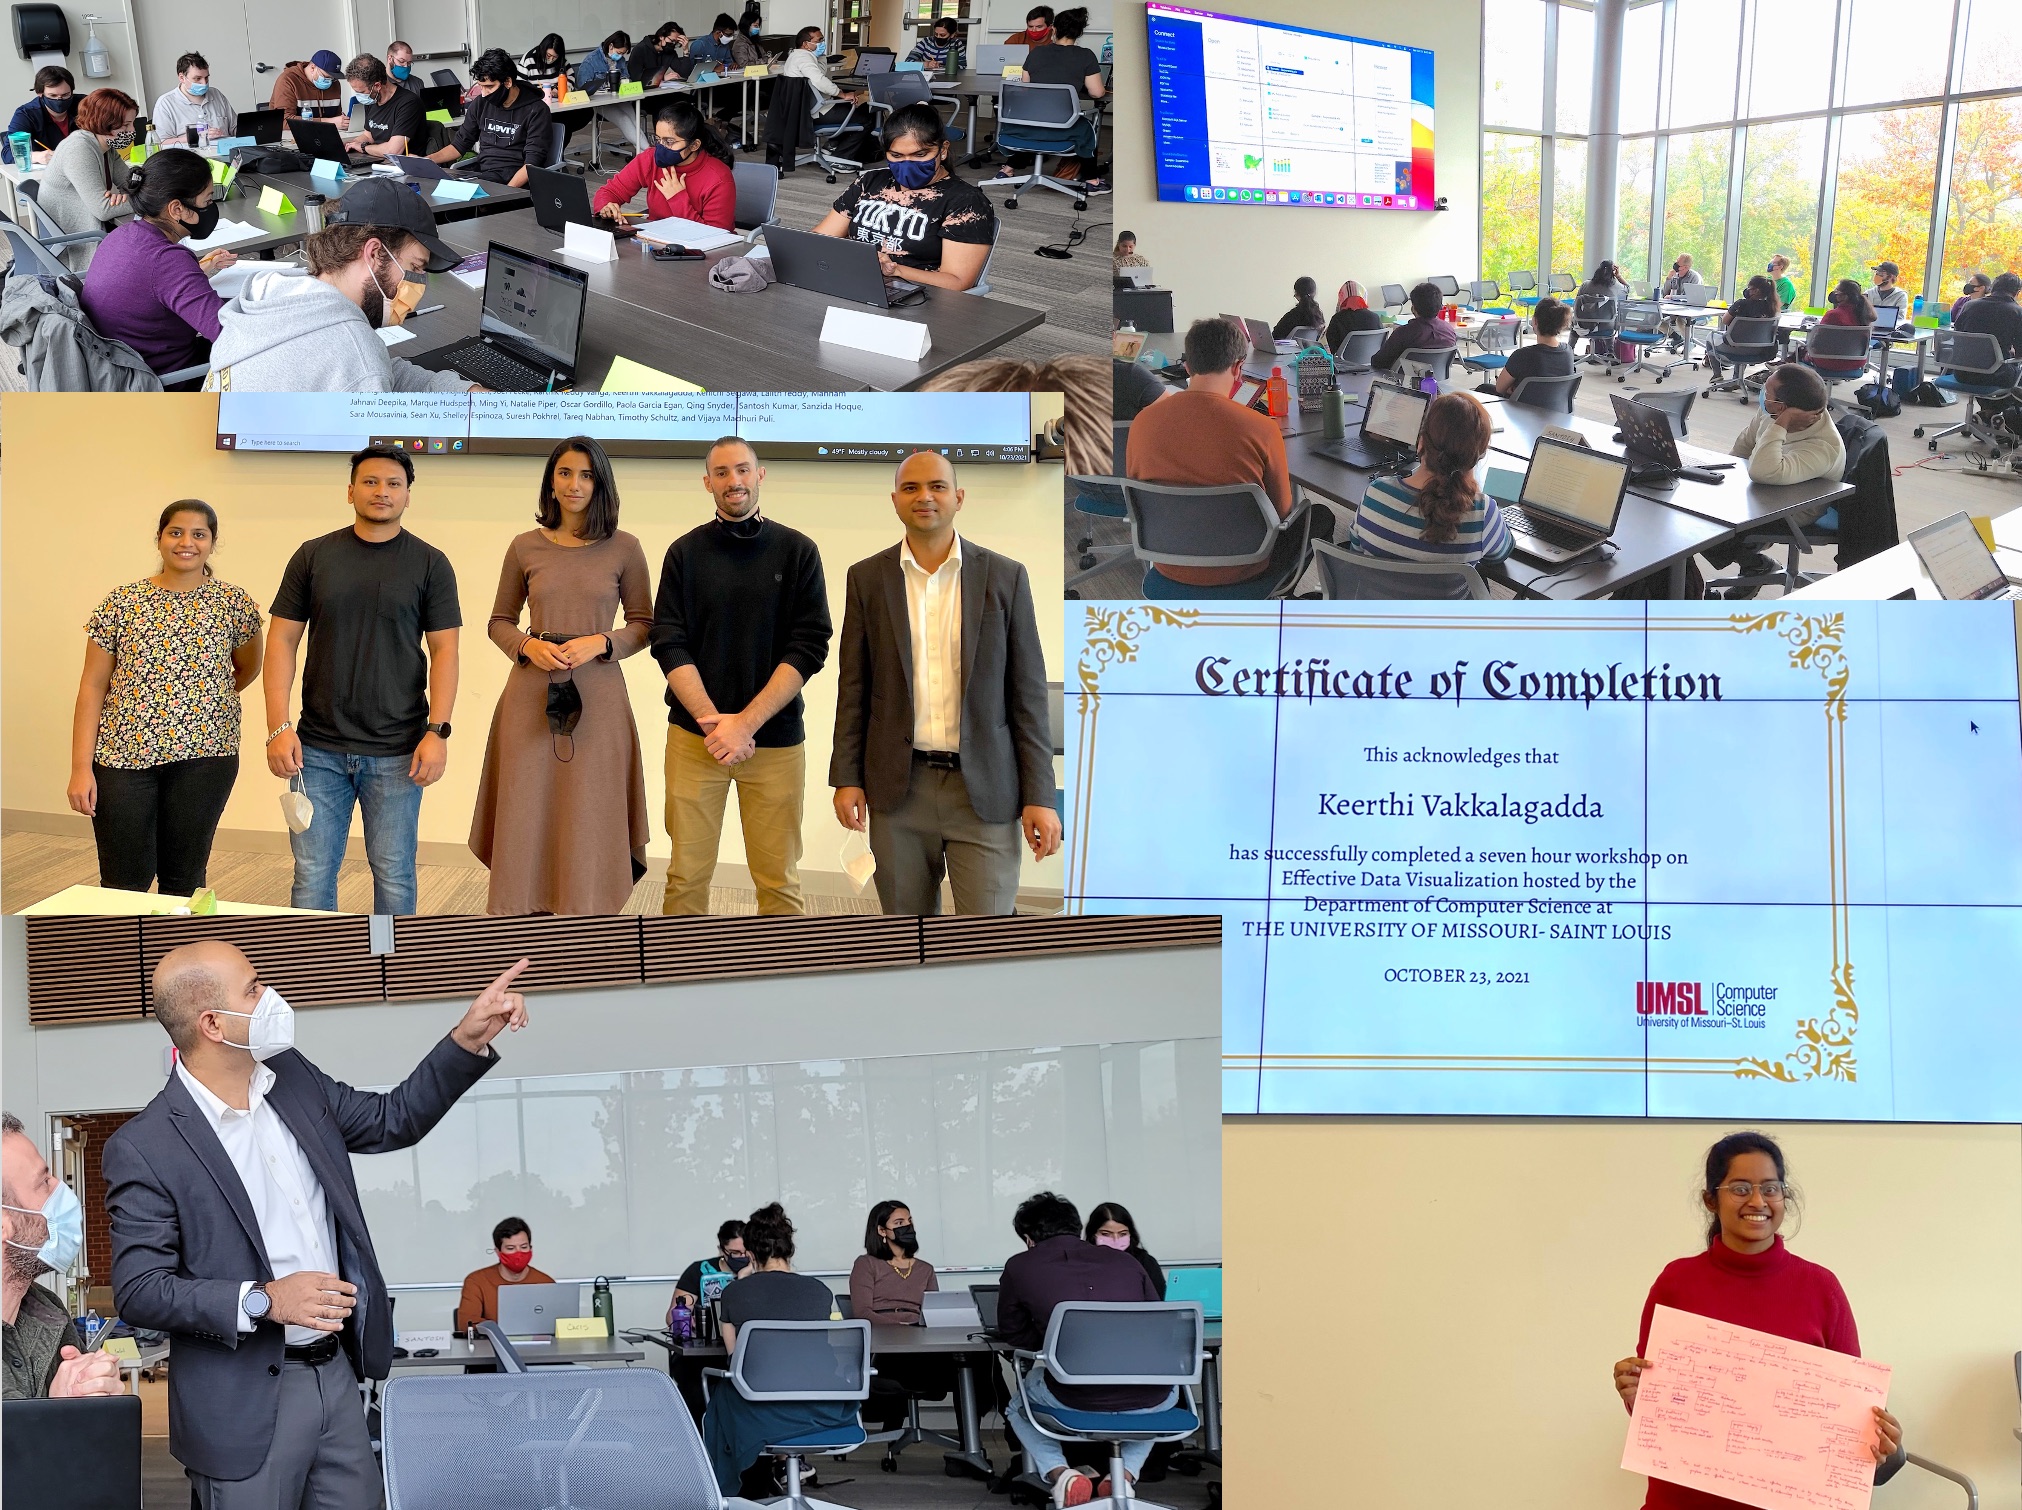
| 3:45 PM | 15 min | 🎓 Certificate & photo |
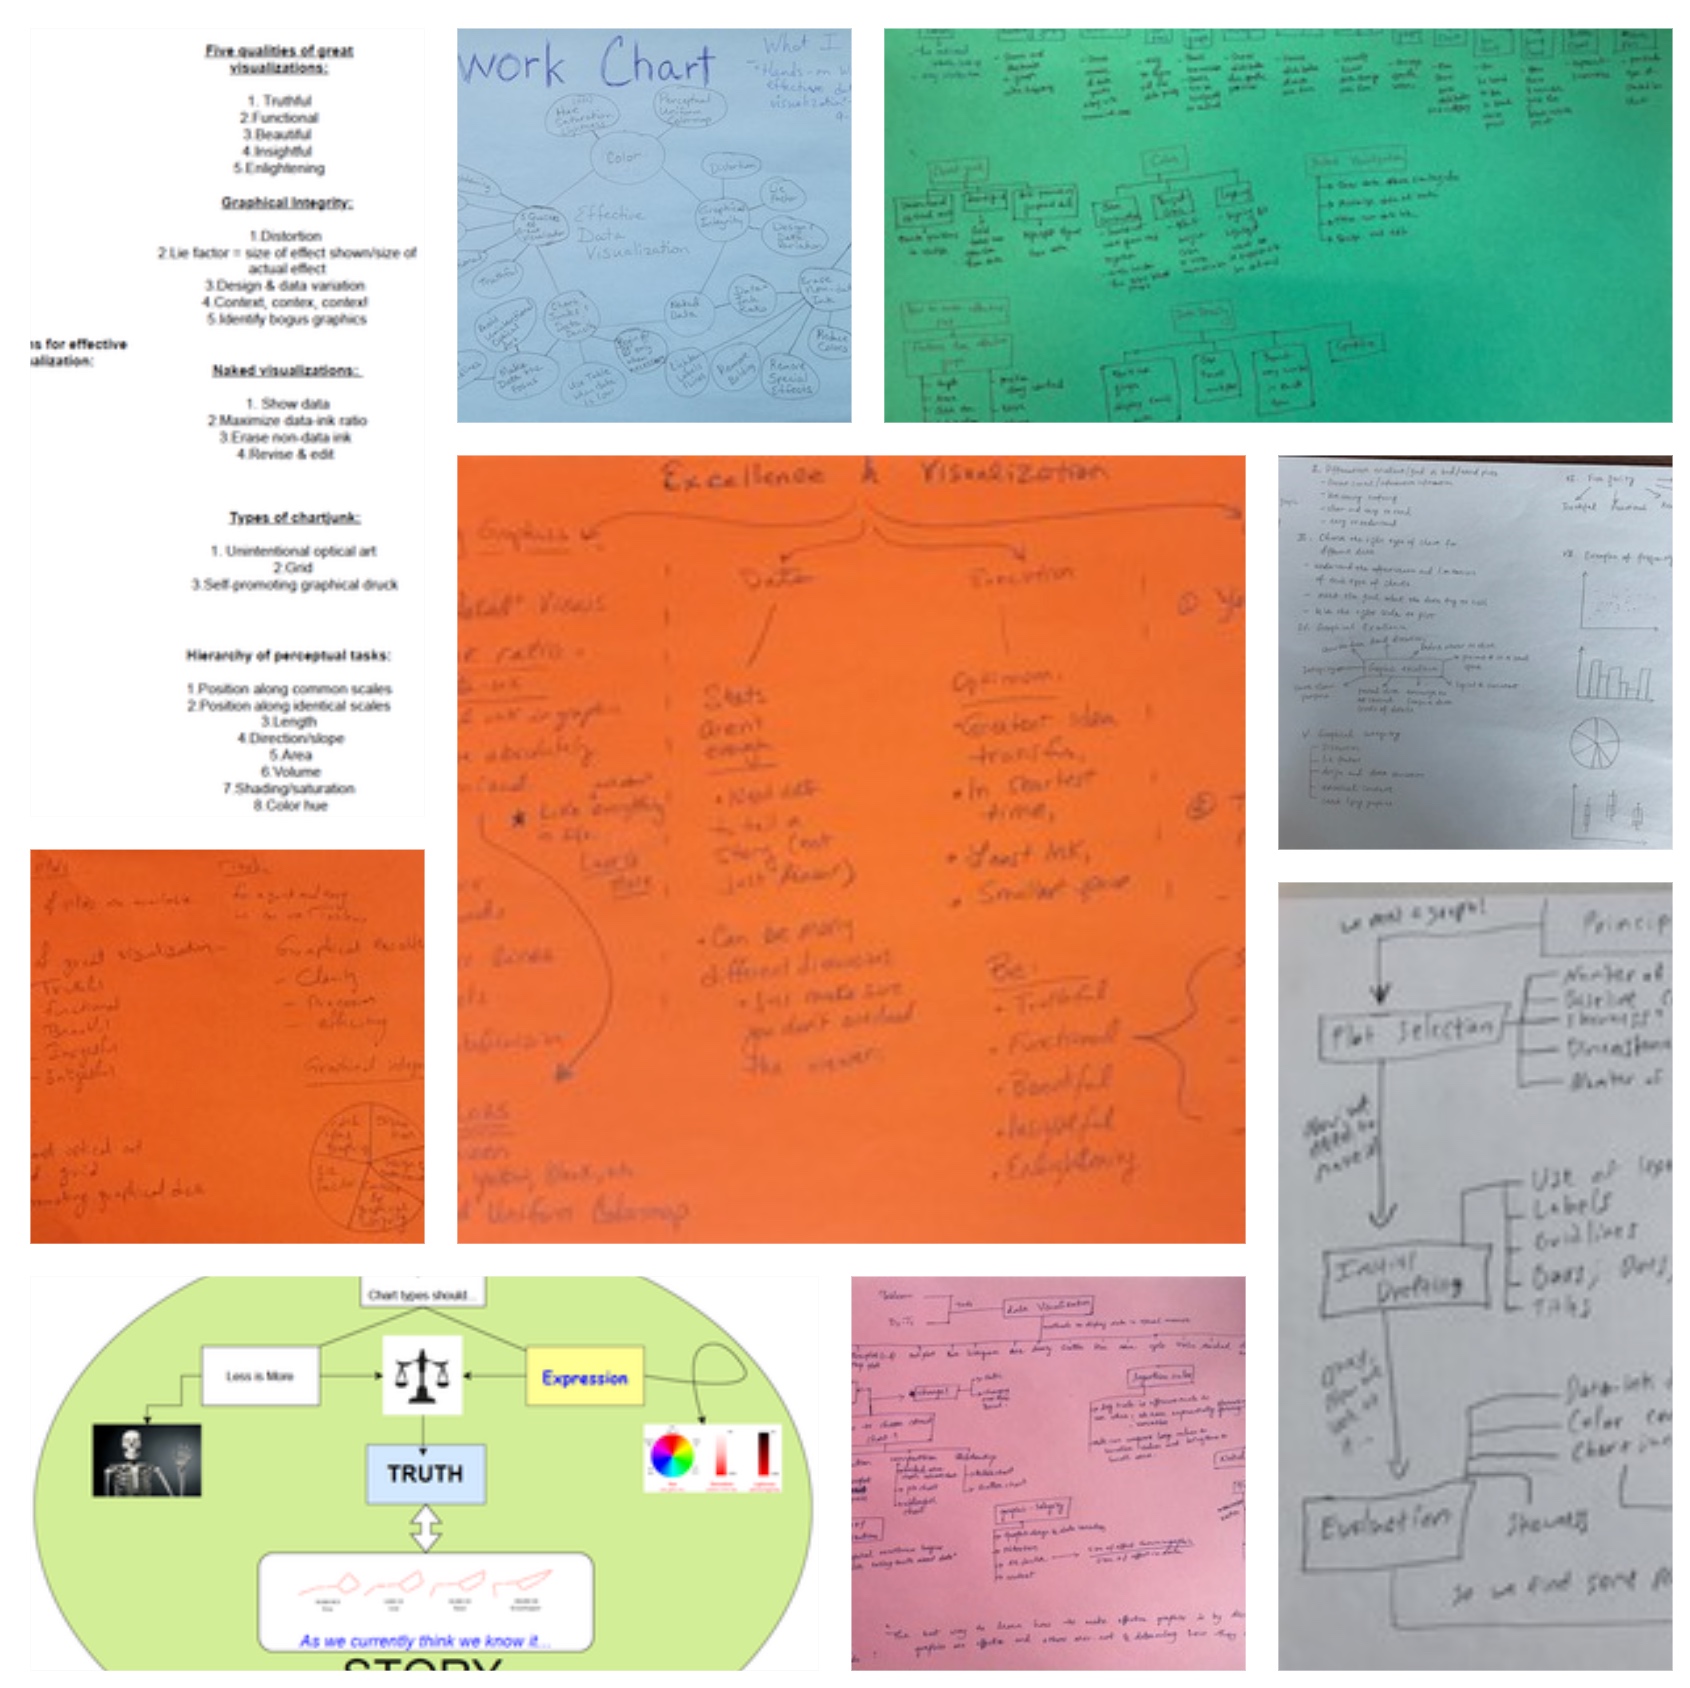
Concept maps
Summary concept maps drawn by the participants at the end of the workshop.
Photos
Acknowledgements
We are thankful to:
- the Department of Computer Science for sponsoring the lunch for all the organizers and the participants,
- the students who reviewed the contents before the workshop: Brian Lindermann, Brett Huffman, Jen Putnam, Timothy Schultz, Reshma Priya Manne Muddu, Warren Truong, Aiden Clark, Mounica Kanakamedala, Dipthi Bitla, and Eric Neal,
- our Dean Andrew Kersten, professors in the Department of Computer Science, and Cynthia Jobe at the Office of Research and Economic & Community Development for their encouragement,
- undergraduate student Torin M. Samuelson for helping us execute the workshop,
- undergraduate student Aia Obeed for designing certificates, preparing the feedback form, and helping us during the day.
We are NOT thankful to Grammarly because we had to pay to use their services. It should be free, at least for students.
Memorables
Those who did not know how to write a computer program thanked us for running a workshop without coding. They had thought that all events by a computer science department involved programming.
Many participants found the automatic timekeeper on the screen to be a ‘genius’ tool. Bikash came up with this idea a day before the workshop when we arranged the tables and chairs at the venue. We are proud of this innovation.
One of the participants confirmed to join at 1 AM that very day (just 8 hours before the start). One of us was still up at that time preparing for the workshop, and we accepted her. At midnight she emailed us asking why she wasn’t accepted. We found out she was accepted, but she had entered an incorrect email address.
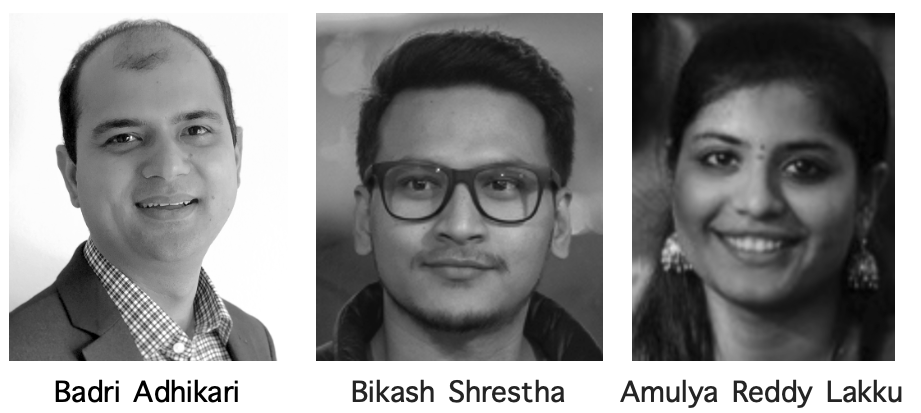
Facilitators