data-viz-workshop-2021
‘A’ correct solution
We should use two graphics to facilitate comparison and assessment.
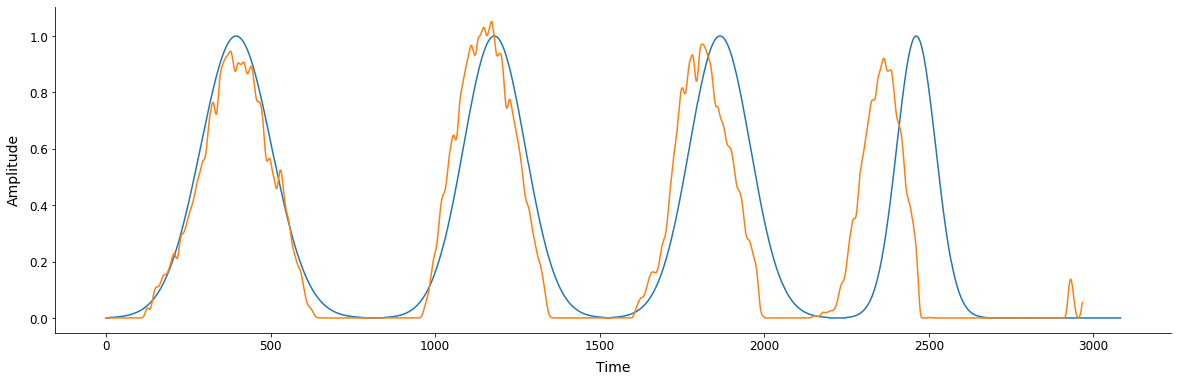
The first plot combines the true and predicted signals within the same view, making comparison easy.
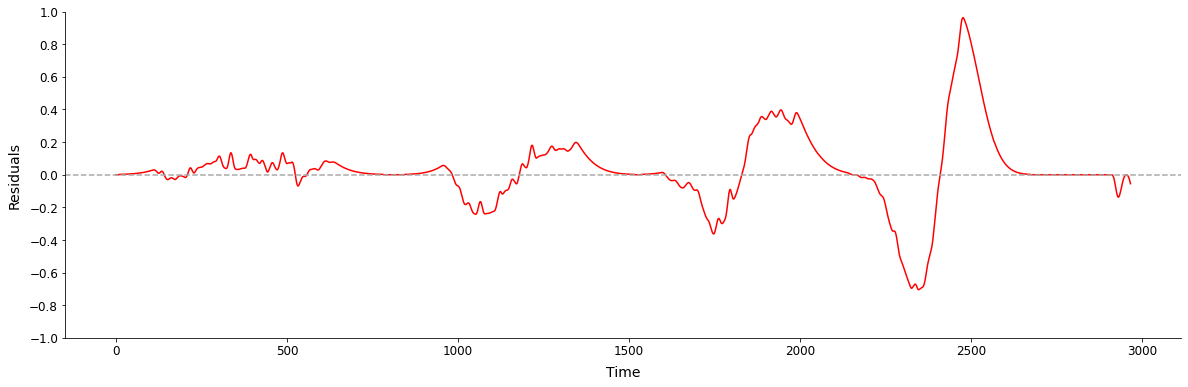
The second plot displays the residuals (difference between the true and predicted signals), making assessment/evaluation easy.