data-viz-workshop-2021
Alberto Cairo’s version of hierarchy of elementary perceptual tasks
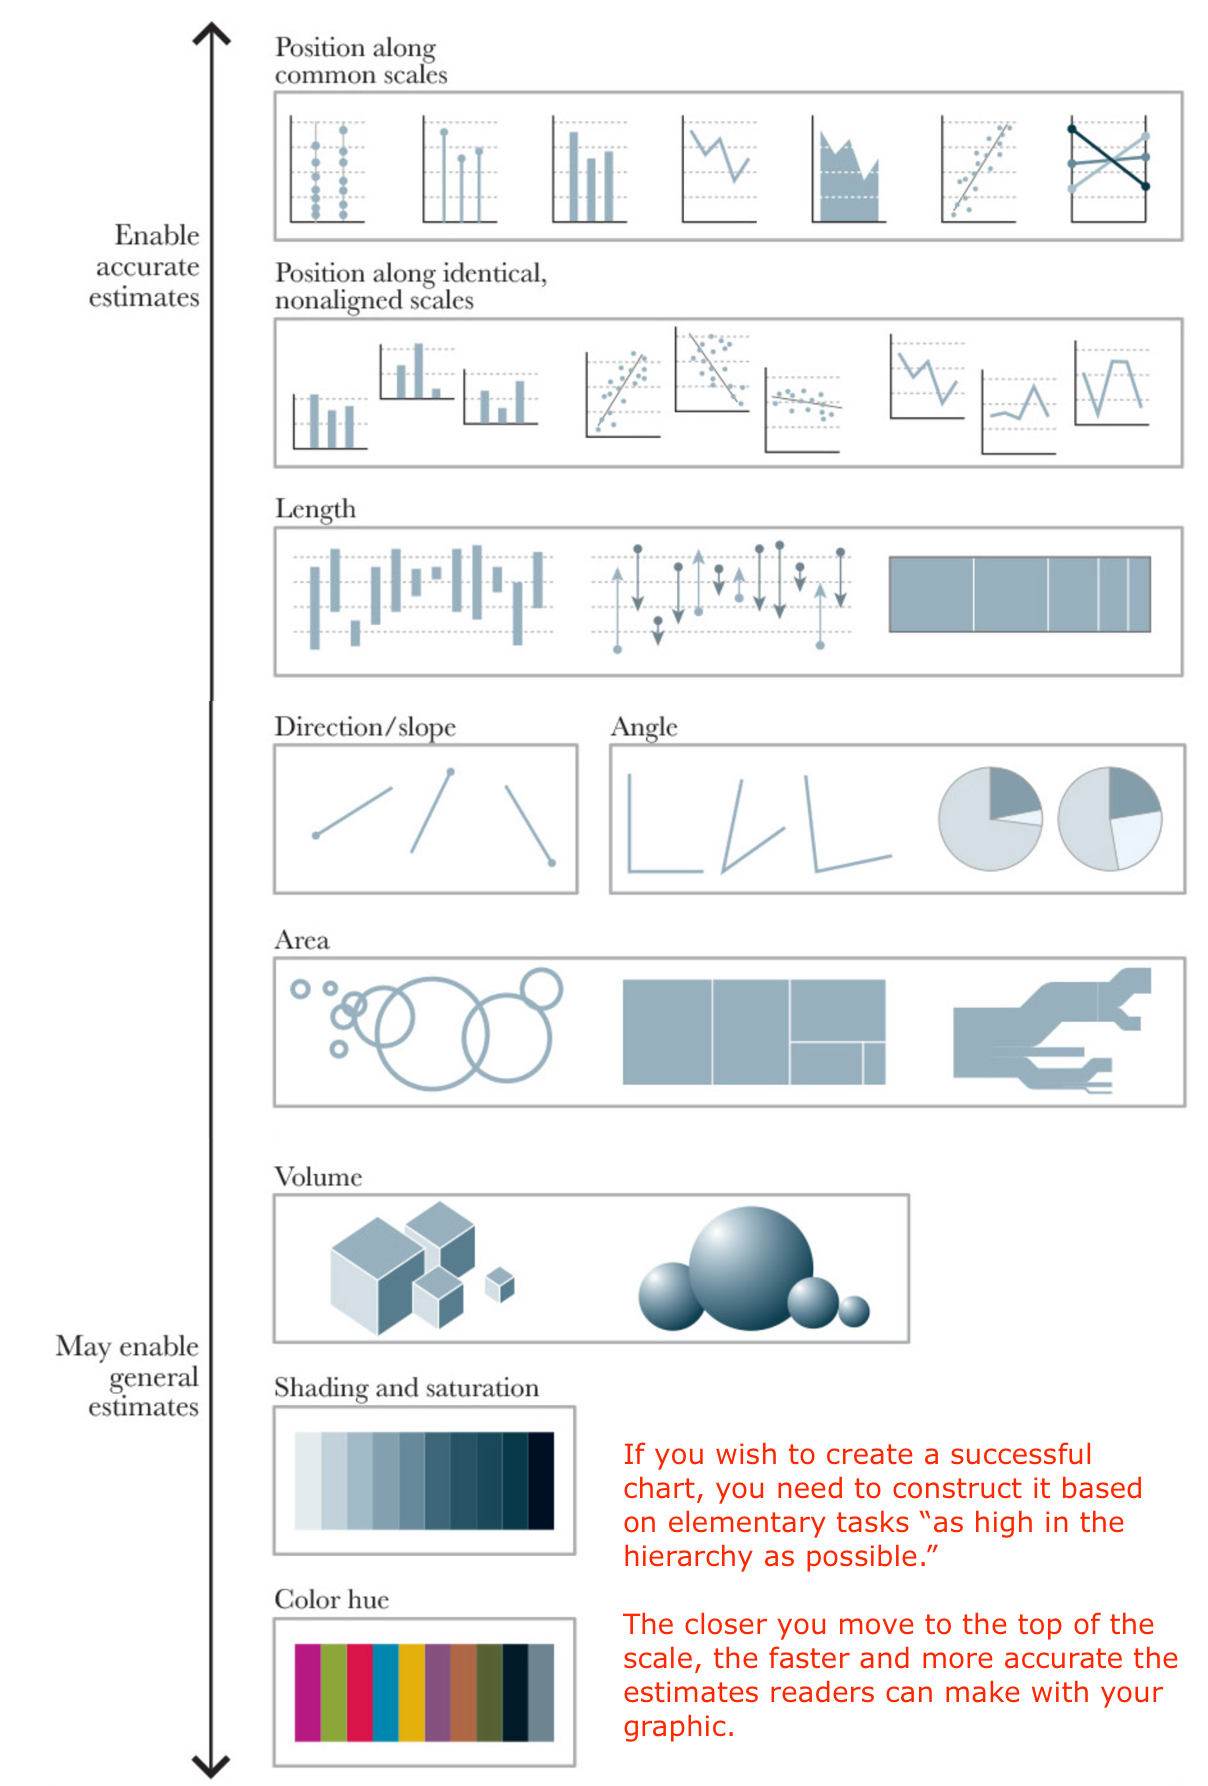
Alberto Cairo (author of The Truthful Art) discusses that his favorite tool to make choices on presenting data is a hierarchy of elementary perceptual tasks or encoding methods that were put together in the 80s by two statisticians, William S. Cleveland and Robert McGill.

“We have chosen the term elementary perceptual task because a viewer performs one or more of these mental-visual tasks to extract the values of real variables represented on most graphs.” - Cleveland and McGill.
In other words, to decode a pie chart, we try to use the angle or the area of the slices as cues. When seeing a bar chart, we may pay attention to the upper edge of each bar or its length or height. When trying to decode a bubble chart, we could compare areas (the right choice) or diameters (which would mislead us).
Cleveland and McGill tested the effectiveness of their perceptual tasks in several experiments. The conclusion was that if you wish to create a successful chart, you need to construct it based on elementary tasks “as high in the hierarchy as possible.” The closer you move to the top of the scale, the faster and more accurate the estimates readers can make with your graphic. Area, color, and angle are much less effective than those graphic forms based on positioning objects on common scales.
A choropleth map is an exception to this rule.