data-viz-workshop-2021
Task: Assessing signal predictions
In one of our projects last week, we were discussing how we could improve the output of our deep learning models. The correct label (ground truth) is a signal that looks like a clean sine wave. Our model needs to predict signals that superimpose (exactly match) the actual/true labels.
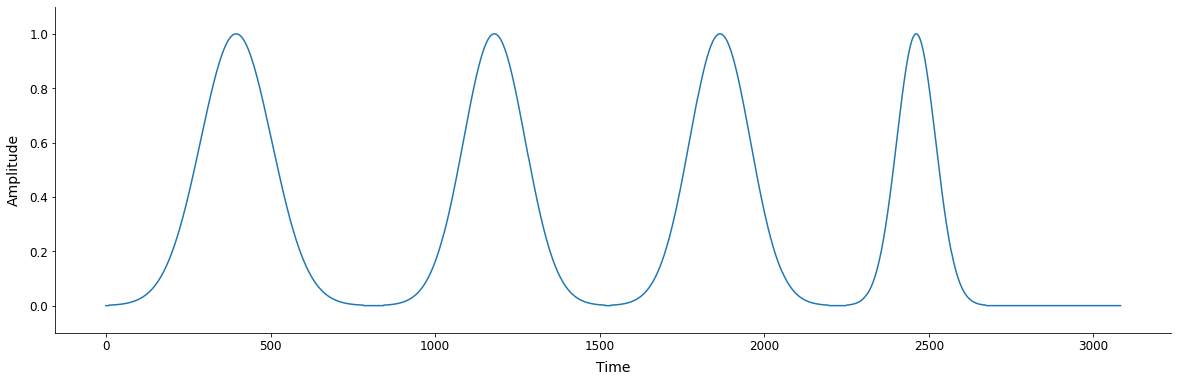
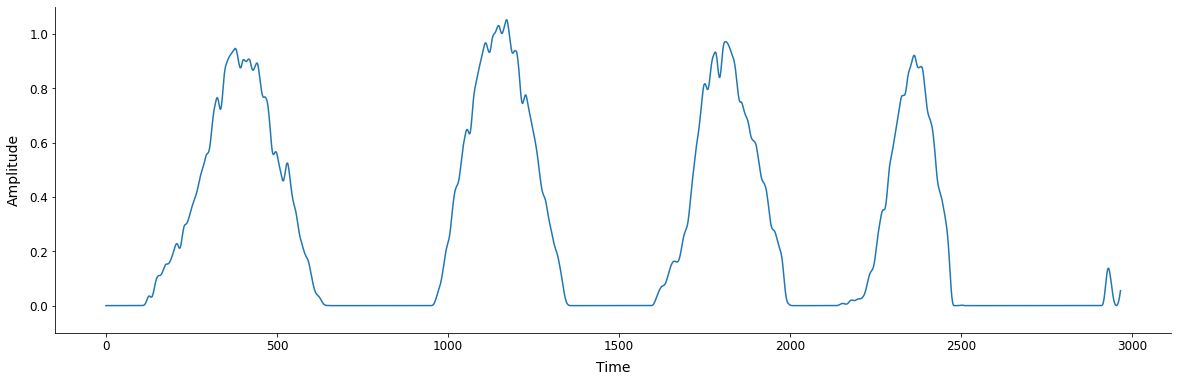
We spend quite some time assessing our predictions (in the bottom subplot) against the ground truths (in the top subplot). We were checking at what time steps our model was making mistakes and by how much.
Would you please suggest how we may revise our visualizations to better assess/evaluate our predicted signals?