data-viz-workshop-2021
Task: Traffic fatalities
According to the World Health Organization, road traffic injuries caused an estimated 1.35 million deaths worldwide in 2016. Source: Wikipedia.
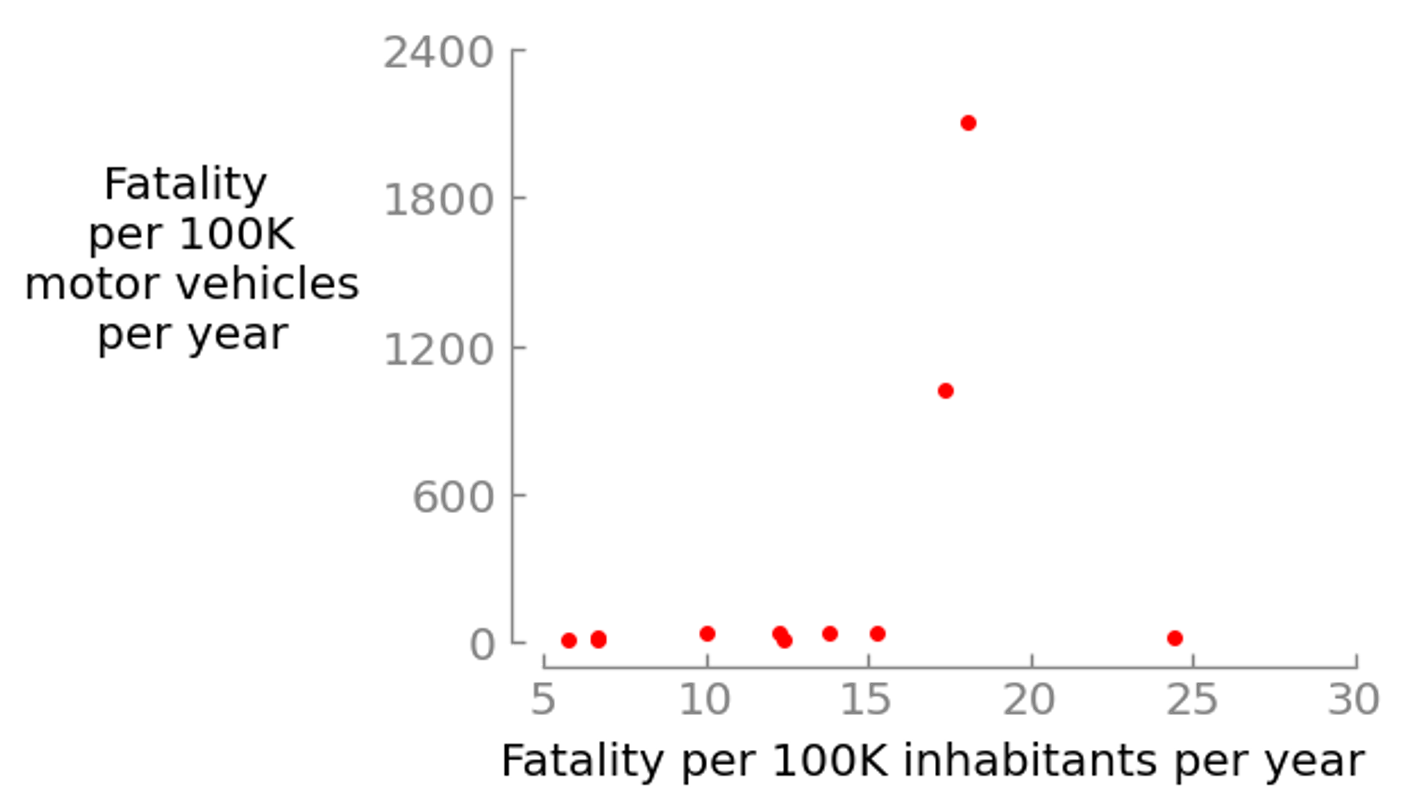
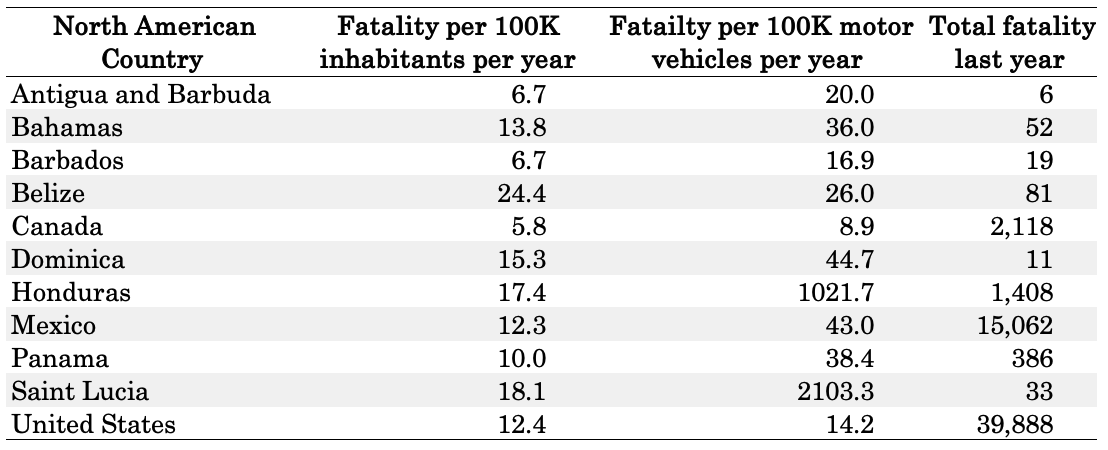
The table below shows the list of some selected countries in North America along with their annual number of traffic fatalities in 2016. Design a graph/plot to show the relationship between the three variables. CSV.
Please sketch your solution in a graph paper!
Here is something that you can start with (but it only has two variables).