DV
The three air pollutants
The data graphic displays the levels of three air pollutants located over a two-dimensional surface (six counties in southern California) at four times during the day.
- Nitrogen oxides (top row) are emitted by power plants, refineries, and vehicles.
- Carbon monoxides (second row) is low after midnight except out at the steel plant.
- Reactive hydrocarbons (last row) come from refineries after midnight and then increase with traffic during the day.
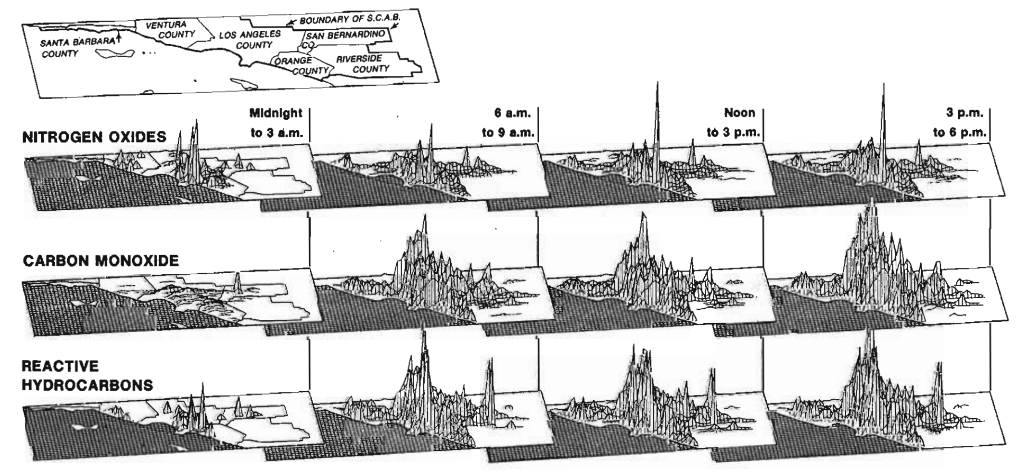
This air pollution display is a small multiple. Small multiples are economical: once viewers understand the design of one slice, they have immediate access to all the other slices.
Question
How many dimensions are there in this data graphic and what are they?